Simulation Mode
Simulation Mode shows how your laser job will execute before running it on the machine. You can step through the G-code and see exactly what will happen.
Activating Simulation Mode
- Keyboard: Press F11
- Menu: Go to View → Simulate Execution
- Toolbar: Click the simulation button
Visualization
Speed Heatmap
Operations are colored by speed:
| Speed | Color |
|---|---|
| Slowest | Blue |
| Slow | Cyan |
| Medium | Green |
| Fast | Yellow |
| Fastest | Red |
The colors are relative to your job's speed range - blue is the minimum, red is the maximum.
Power Transparency
Line opacity shows laser power:
- Faint lines = Low power (travel moves, light engraving)
- Solid lines = High power (cutting)
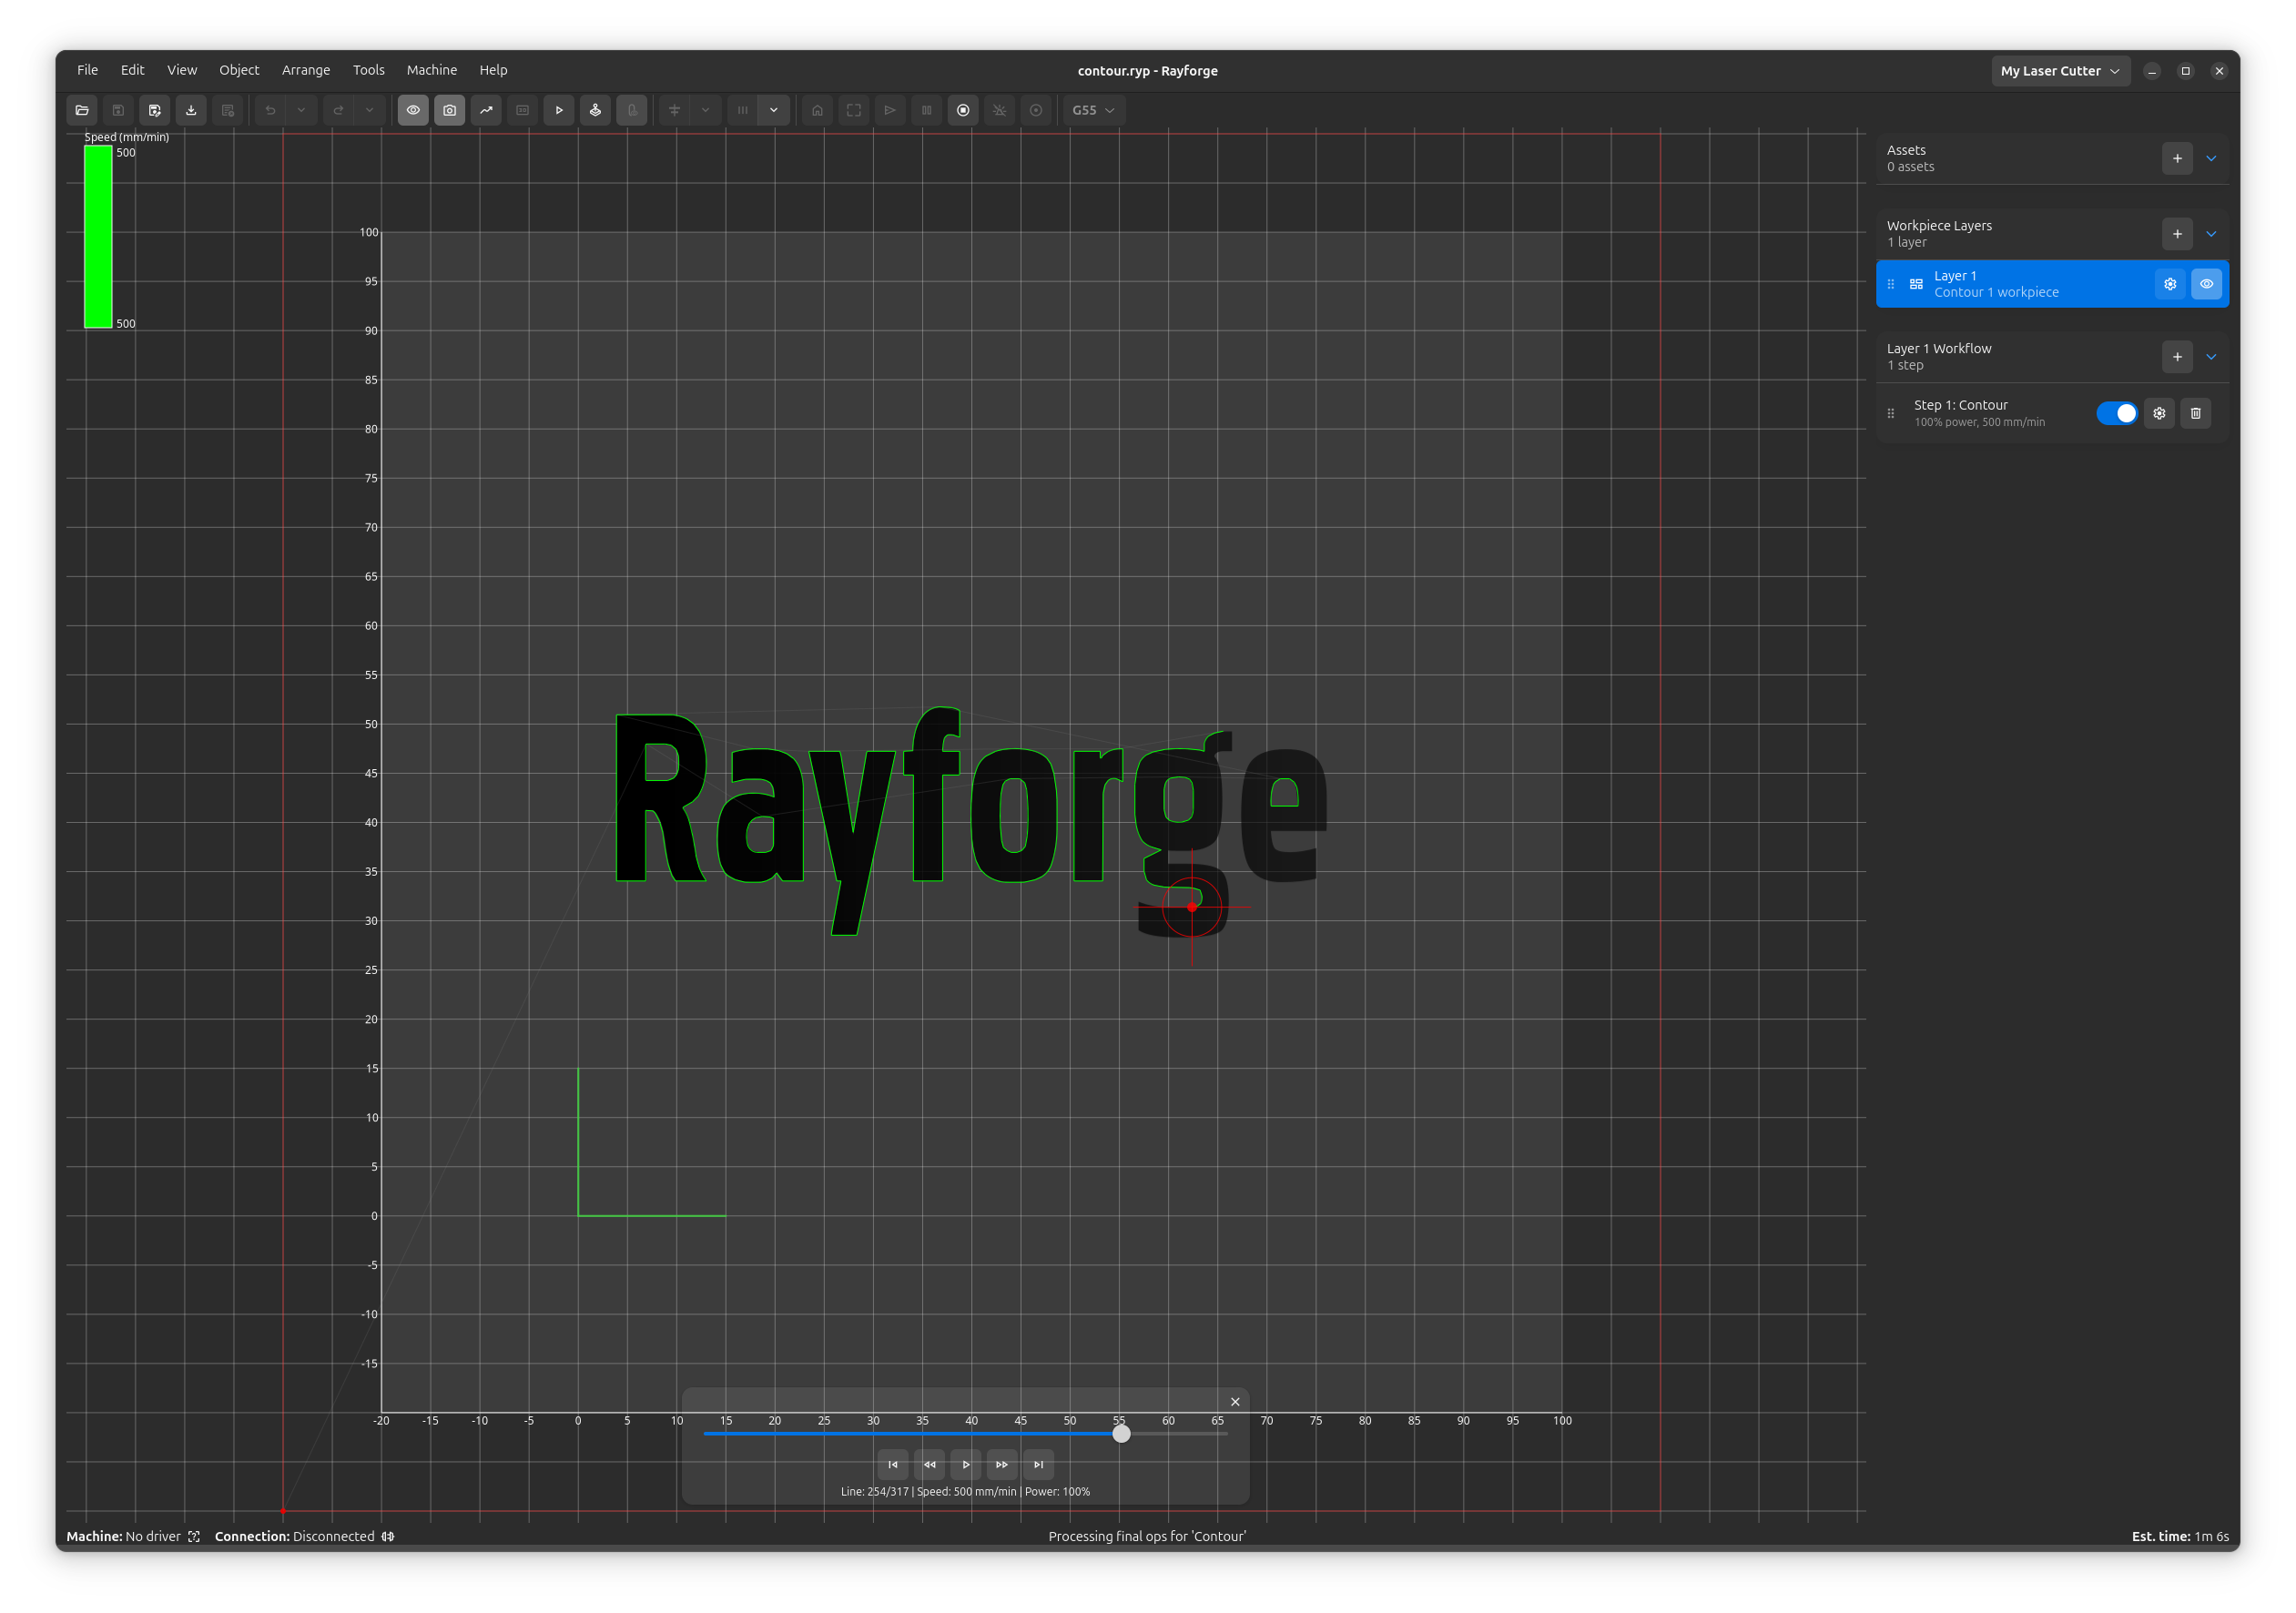
Playback Controls
Use the controls at the bottom of the canvas:
- Play/Pause (Space): Start or stop automatic playback
- Progress slider: Drag to scrub through the job
- Arrow keys: Step through instructions one at a time
The simulation and G-code view stay in sync - stepping through the simulation highlights the corresponding G-code, and clicking G-code lines jumps to that point in the simulation.
Editing During Simulation
You can edit workpieces while simulating. Move, scale, or rotate objects, and the simulation updates automatically.
Related Topics
- 3D Preview - 3D toolpath visualization
- Material Test Grid - Use simulation to validate tests